Over the past weekend, my family and I took a road trip to a rural location where the upper Delaware River separates northeast Pennsylvania from New York. Through an old friend, my wife made arrangements for us to take our two young boys to an old, restored summer camp deep in the woods where we’d have the entire expansive property to ourselves. When first hearing of this plan, I’d be lying if I said I didn’t immediately envision those old 1980’s slasher films set at a remote campground deep in the forest. Let me tell you, if I had stumbled across an old hockey mask near the lake, I would’ve raced out of there as fast as my ancient Volvo could take us on the winding dirt roads.
Alas, it ended up being a wonderful trip with cabins, canoes, a lake, creeks, fishing, fire pits, smores and the whole nine yards. One element that was particularly pleasant was seeing the stunning fall foliage during our long drive. While the aspens in Colorado are a sight to behold, there’s nothing quite like the changing fall colors in the northeast United States. However, during our drive, we also noticed additional colors that dotted the landscape – the red, white and blue of many Trump/Vance and Harris/Walz yard signs. This provided a constant reminder that the presidential election is mere weeks away.
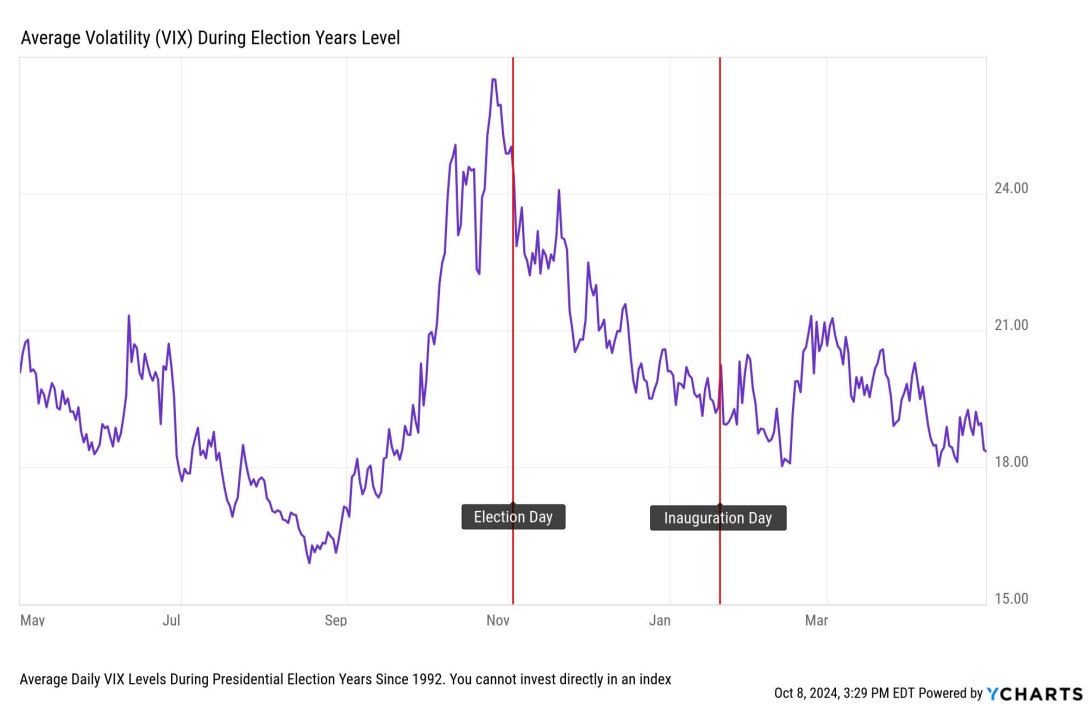
A presidential election can create quite a bit of public angst and, in election years, sometimes this angst and uncertainty can spill-over into financial markets in the form of volatility. The chart below helps to illustrate this dynamic by showing the average level of volatility – as measured by the CBOE Volatility Index (VIX) – during each election year since 1992. As a reminder, we consider a VIX reading above 20 to indicate above average volatility, meaning that daily swings in the markets will be more pronounced.
As indicated by the purple line in the chart above, it’s plain to see that the stock market – historically speaking – has seen a brief spike in volatility in the weeks leading into a presidential election. Volatility in the stock market then settles-down as the U.S. moves toward inauguration day in January.
When thinking about broad stock market performance during presidential election cycles, the chart below shows us what investors have experienced since 1952. This chart shows different examples of S&P 500 performance on the day after the election, then in the two month period after Election Day.
It should come as no surprise that the most significant and negative market reaction occurred in November of 2008 when the U.S. economy was in the throes of the great financial crisis. However, beyond that, the average market reaction since 1952 has been somewhat muted when looking at both the day after an election (-0.23% and in the two months after an election (+2.00%).
The bottom line is that elections represent another element of uncertainty but, generally speaking, markets tend to be somewhat ambivalent to politics. Can future policy initiatives of an administration impact the stock market? Of course. For a cautionary tale, you can read my recent CIO Mailbag post that details how regulatory crackdowns in China destroyed shareholder value in some of the largest publicly traded companies in the world. Clearly, we do not anticipate such an outcome here in the United States.
Price at the Pumpkin
At the September Federal Open Market Committee Meeting, the Fed finally cut interest rates by 0.50% and projected another 0.25% rate cut at the November meeting and another 0.25% rate cut at the Fed’s December meeting. That would bring the effective fed funds rate down 1.00% (#math) from its 2024 peak of 5.33%. That, of course, is all assuming that inflation does its part and continues on a downward path to the Fed’s 2% target. Will that happen? Well, we will try to assess the state of inflation while also addressing one of the most pressing questions this month – what does this inflation mean for pumpkin and candy prices heading into Halloween?
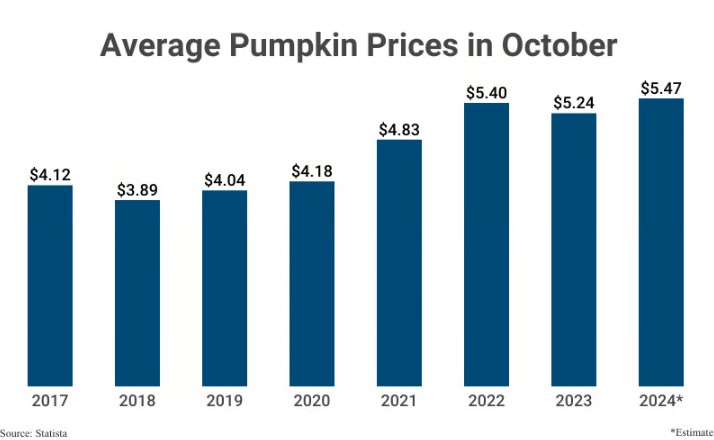
First we’ll look at prices at the pumpkin patch. As you can see in the graph below, the average price of pumpkins soared nearly 30% between 2020 and 2022, stunning pumpkin carvers nationwide. Since then, prices have stabilized a bit, but remain at much higher levels than we saw back in pre-pandemic years. Personally, in seeing this chart, I’m feeling quite smug about the two-for-$5 pumpkin deal we sourced for our two boys.
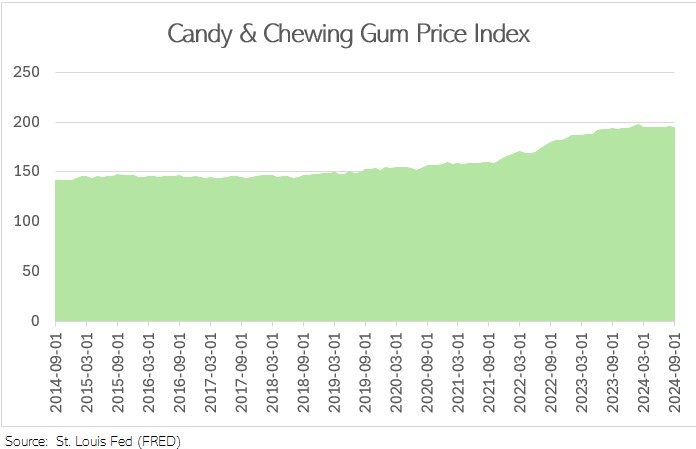
When it comes to candy prices, we’re seeing a similar trend where prices began to surge in 2021, but have since leveled-off as you can see in the chart below that illustrates data from the St. Louis Fed.
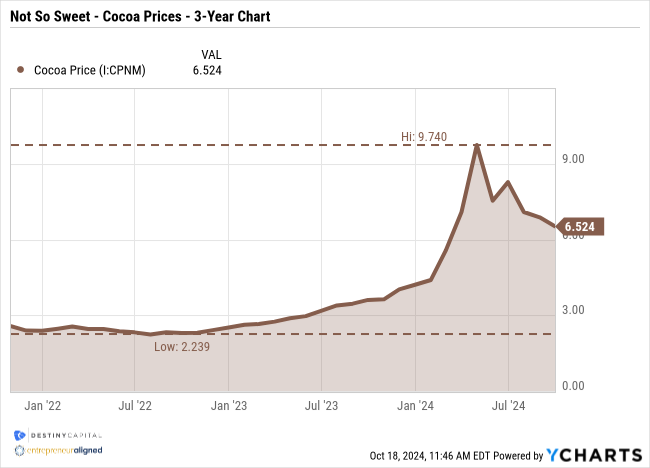
However, the chart above doesn’t tell the entire story when it comes to the confectionery market. In the 2024 Halloween season – and to my utter despair – we may be seeing a shift away from chocolatey treats to more of the chewy/gummy/twizzler varietals of candy. Why is this? Well, in 2024, consumers have seen a staggering surge in the price of cocoa which, obviously, is a key ingredient on most halloween chocolate bars. In fact, a story by CNBC reported that, in April of 2024, the price of cocoa peaked at roughly $11,000 per metric ton vs. just $2,500 in previous years. The chart below helps to illustrate the surge in cocoa prices that began in 2023 and accelerated in early 2024.
Will there be fewer Snickers bars, Hershey’s bars, Reese’s Cups, Twix, 3 Musketeers or even the elusive 100 Grand bars for parents and/or grandparents to pilfer from their children’s/grandchildren’s halloween basket this year? Only time will tell. However, looking beyond Halloween-centric prices, there are other elements of inflation that have caught our eye in recent months at Destiny Capital.
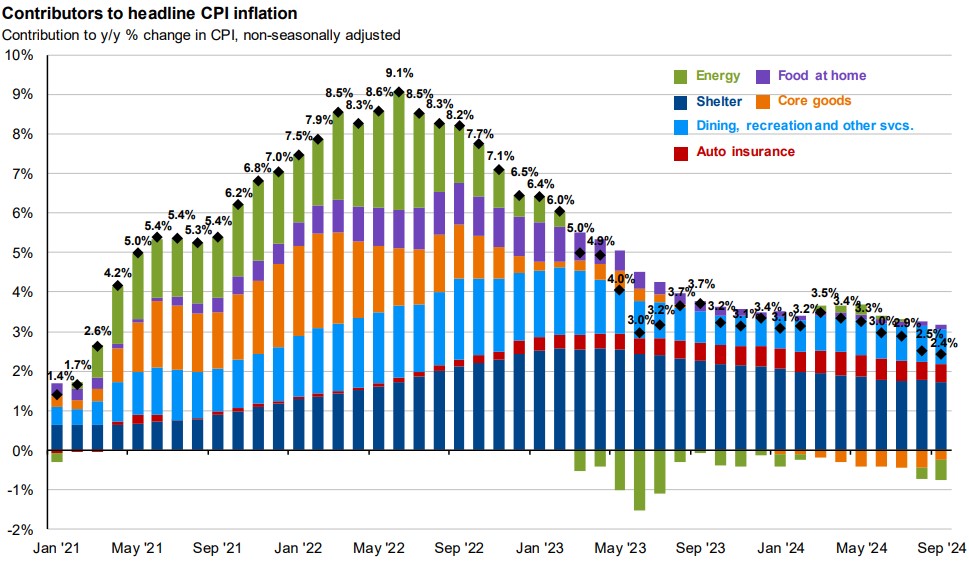
The chart below illustrates some of the primary contributors to the Consumer Price Index (CPI), and the impact that each is having on aggregate prices. As you can see, significant progress has been made when considering prices for energy, core goods, and food at home. However, we’ve seen one inflation contributor begin to surge since the summer of 2022 – auto insurance – as you can see illustrated as the expanding red bar below.
Source: JP Morgan Guide to the Markets
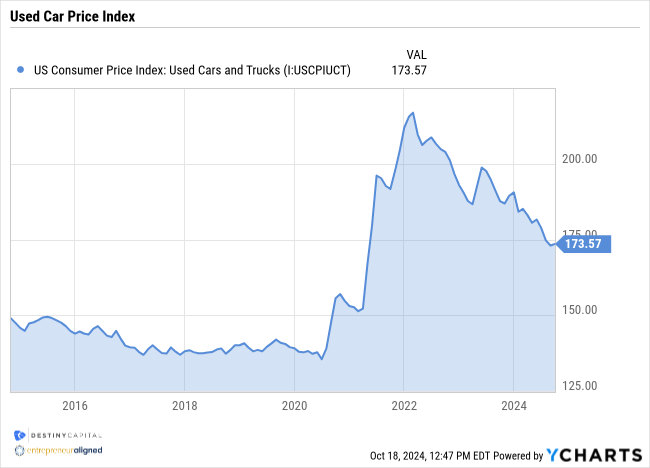
Did all U.S. drivers suddenly get into one collective fender bender? Yes, we saw a surge in car prices – particularly used car prices – as inflation surged in 2022. However, those prices have since fallen considerably from their peak in early 2022, as you can see in the Used Car Index component of the Consumer Price Index (CPI) below.
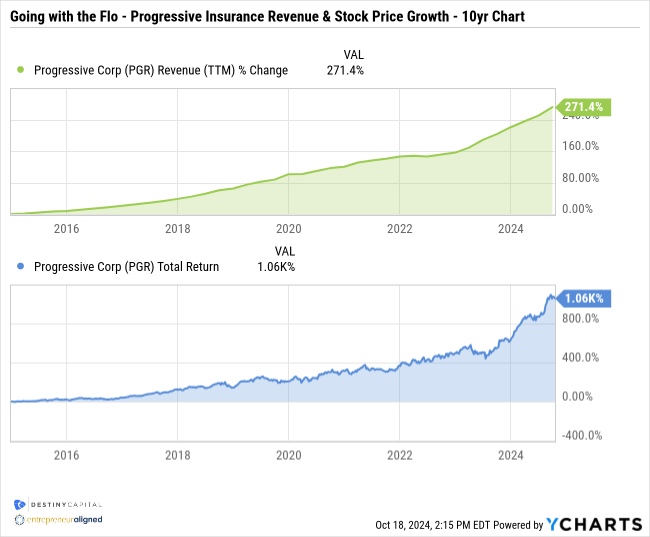
With my curiosity piqued and in search of some answers, I decided to review the financials of the largest auto insurer in the United States and the company who made Flo a household name – Progressive Corp (PGR). The results of my brief financial review were eye opening. As you can see in the two stacked charts below, Progressive’s revenues (green) have surged considerably since 2023 and are now up 271.4% over the past ten years. A similar surge is seen in the performance of Progressive’s stock, as represented by the blue chart below. Over the past 10-years, Progressive stock has produced roughly a total return of 1,060% versus 239% for the S&P 500 index.
Are surging revenues and a soaring stock price due to significant growth in Progressive’s auto policy business line, or are they primarily due to significant price increases of each policy that is underwritten? Is it a coincidence that we see a sudden surge in Progressive’s revenues and stock price right around the time that we see auto insurance prices surge as measured in the consumer price index?
The key question for investors is whether or not price increases in auto insurance will continue to hurt the Fed’s chances of reaching its 2% inflation target. That certainly appeared to be the case in September’s CPI report which showed Headline CPI at 2.4% and Core CPI at 3.3%. To the dismay of the Fed, both figures were 0.1% above the consensus estimates of 2.3% Headline and 3.2% Core. In addition to auto insurance prices, the shelter index – as usual – was the largest contributor to the increase in the all-items index.
As it stands now, investors still appear to be pricing-in two 0.25% rate cuts between now and year end, which is exactly what the Fed has projected. However, another ‘hot’ inflation report (or two) and we could potentially see a deviation from that plan. Therefore, we’d expect that, in the near term, any additional uncertainty around future monetary policy could impact financial markets far more than the outcome of the upcoming election.
Important note and disclosure: This article is intended to be informational in nature; it should not be used as the basis for investment decisions. You should seek the advice of an investment professional who understands your particular situation before making any decisions. Investments are subject to risks, including loss of principal. Past returns are not indicative of future results. Advisory services provided by Destiny Capital Corporation, a registered investment adviser.
2024 YCharts, Inc. All Rights Reserved. YCharts, Inc. (“YCharts’) is not registered with the U.S. Securities and Exchange Commission (or with the securities regulatory authority or body of any state or any other jurisdiction) as an investment adviser, broker-dealer or in any other capacity, and does not purport to provide investment advice or make investment recommendations. This report has been generated using data manually input by the creator of this report combined with data and calculations from YCharts.com and is intended solely to assist you or your investment or other adviser(s) in conducting investment research. You should not construe this report as an offer to buy or sell, as a solicitation of an offer to buy or see, or as a recommendation to buy, sell, hold or trade, any security or other financial instrument. THE IMPORTANT DISCLOSURES FOUND AT THE END OF THIS REPORT (WHICH INCLUDE DEFINITIONS OF CERTAIN TERMS USED IN THIS REPORT) ARE AN INTEGRAL PART OF THIS REPORT AND MUST BE READ IN CONJUNCTION WITH YOUR REVIEW OF THIS REPORT. Disclosure – YCharts
